Grant Portfolio Dashboards for Foundations — Shareable Reporting to Boards & Grantees
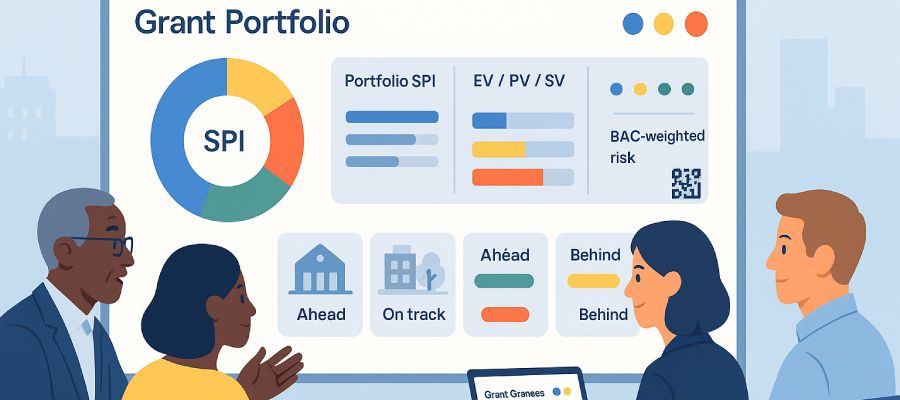
Roll up many grants into a live grant portfolio dashboard your board and program teams can actually use. FolioProjects makes it easy to present schedule EVM (EV, PV, SPI, SV), BAC-weighted risk, and HueFlux stakeholder voting in a shareable view—no heavy PPM stack required.
Why Foundations Need a Grant Portfolio Dashboard
Program officers juggle many grantees, each sending status emails, PDFs, and spreadsheets. Boards want a concise, comparable view across the portfolio. A grant portfolio dashboard consolidates status into a single place you can share privately with the board—or publish portions for transparency.
- Comparability: every project reports the same core signal—SPI for schedule, risk, and engagement—so your board can scan quickly.
- Shareability: publish a read-only view, embed on your site, or distribute via secure links—no extra logins for observers.
- Actionability: trends and risk surface earlier, reducing last-minute scramble before quarterly meetings.
Outcomes You Can Expect
- Faster reviews: board books shrink; members arrive prepared because they’ve seen live status.
- Better support to grantees: risk and sentiment trends reveal where extra help (or scope adjustment) is needed.
- Public accountability (optional): publish a portfolio overview with selected metrics; keep sensitive details private.
What the Portfolio Dashboard Shows
FolioProjects rolls up project-level signals into a clear, portfolio-level snapshot:
- Portfolio SPI (schedule performance):
ΣEV ÷ ΣPV. Status bands: Ahead (≥1.05), On track (0.95–1.05), Behind (<0.95). Learn the model in Project Health — EVM (Schedule). - EV / PV / SV totals: ΣEV, ΣPV, and Σ(EV−PV) for the portfolio (schedule only; CPI is excluded unless Actual Cost is provided elsewhere).
- BAC-weighted risk: average risk weighted by each project’s budget (Budget at Completion), with total risk count.
- HueFlux stakeholder voting: aggregate sentiment across grantees—internal (blue), external (yellow), and negative (red) signals—useful for public-facing programs and community initiatives. See HueFlux.
- Timeline window: earliest start and latest end across the grant cohort.
- Engagement: visitors, subscribers, and link clicks via Analytics.
Clean UX: items without data are hidden (no wall of “TBD”). As grantees populate fields, rows appear automatically.
How to Set It Up in FolioProjects (Step-by-Step)
- Create a portfolio and invite grantees to add their projects. See Projects for creation basics.
- Standardize required fields for each grantee project:
- Start date & end date (for PV)
- Milestones (for EV)
- Planned budget (BAC)
- Optional: risk entries and stakeholder voting via HueFlux
- Enable schedule health on each project. The dashboard computes EV, PV, SPI, and SV automatically. See Project Health — EVM (Schedule).
- Choose privacy: keep the full portfolio private to the board, or publish a public overview while restricting detailed tabs. See Sharing & Embeds.
- Embed or share the portfolio dashboard link with the board; optionally post a public overview on your site.
- Establish cadence: ask grantees to update milestones and notes monthly; set a portfolio review on a fixed day (e.g., first Monday).
Governance, Privacy & Access
- Public vs. member-only: show top-level metrics publicly (status, milestones, summary), keep financials or sensitive docs private. Adjust anytime.
- Schedule-only EVM: FolioProjects reports EV, PV, SPI, and SV. CPI is not shown unless you provide Actual Cost from finance systems.
- HueFlux moderation: use internal/external weighting to reduce brigading; rate-limit if needed. Aggregate signals for portfolio context.
- Data provenance: link original PDFs (grant agreements, interim reports) so auditors can trace decisions.
Quarterly Reporting Workflow
- Two weeks out: nudge grantees to refresh milestones and risks; ask for quick notes on blockers.
- One week out: portfolio owner reviews SPI trends and risk changes; tags items needing discussion.
- Board prep: export a slim deck or share the read-only portfolio link with a short “what changed this quarter” narrative.
- Meeting day: open the live dashboard; drill into any project with unexpected SPI movement or negative HueFlux spikes.
- Follow-up: log actions as tasks in grantee projects; subscribers get notified automatically.
Examples & Metrics That Matter
These KPIs are simple enough for boards and donors, but meaningful for program staff:
- Portfolio SPI (ΣEV/ΣPV): are grantees, in aggregate, ahead/on/behind schedule?
- SV total (Σ(EV−PV)): magnitude of schedule variance across the portfolio.
- BAC-weighted risk average: high-budget, high-risk programs are highlighted for discussion.
- HueFlux trend: rising red or falling yellow signals where communications or scope support is needed.
- Engagement: visitors, subscribers, and link clicks to shared resources or reports.
Tip: Use UTM parameters on shared links to identify which board emails or web pages drive the most engagement. See Analytics.
FAQ
Do grantees need to learn a new tool?
FolioProjects focuses on essentials—dates, milestones, risk notes, and links. Many teams can get started the same day. You choose whether to keep dashboards private or make overviews public.
Can we include financials?
Yes, as linked artifacts or custom fields. Out-of-the-box we emphasize schedule EVM for clarity. If you maintain Actual Cost elsewhere, you can link to financial dashboards while keeping the portfolio SPI front and center.
How do we prevent sentiment brigading?
Use HueFlux with internal/external weighting, enable simple rate limits, and watch Analytics for anomalies. Because HueFlux is a quick signal (not free-text), moderation is straightforward.
What about accessibility?
Dashboards pair color with text labels (e.g., Ahead/On/Behind), support mobile layouts, and allow descriptive alt text and links—important for donor and community access.
SEO keywords used naturally: grant portfolio dashboard, foundation reporting dashboard, grantee status, portfolio SPI, EV, PV, SV, BAC-weighted risk, HueFlux, stakeholder voting, public portfolio dashboard, board reporting.